Writing Like a Pro with Markdown, Mermaid, and LaTeX
Capstone Design
Imron Rosyadi
Writing Like a Pro with GitHub Flavored Markdown, Mermaid, and LaTeX
Learning Objectives
By the end of this session, you will be able to:
- Write clear documents using GitHub Flavored Markdown (GFM).
- Create structured diagrams with Mermaid directly in Markdown.
- Write mathematical equations using LaTeX syntax inside Markdown.
- Combine text, diagrams, and equations into rich technical documentation for ECE projects.
Big Picture: Why These Tools Matter
- Most engineering collaboration happens in:
- GitHub READMEs and wikis.
- Issues and pull requests.
- Documentation repos (e.g., MkDocs, Quarto, Docusaurus).
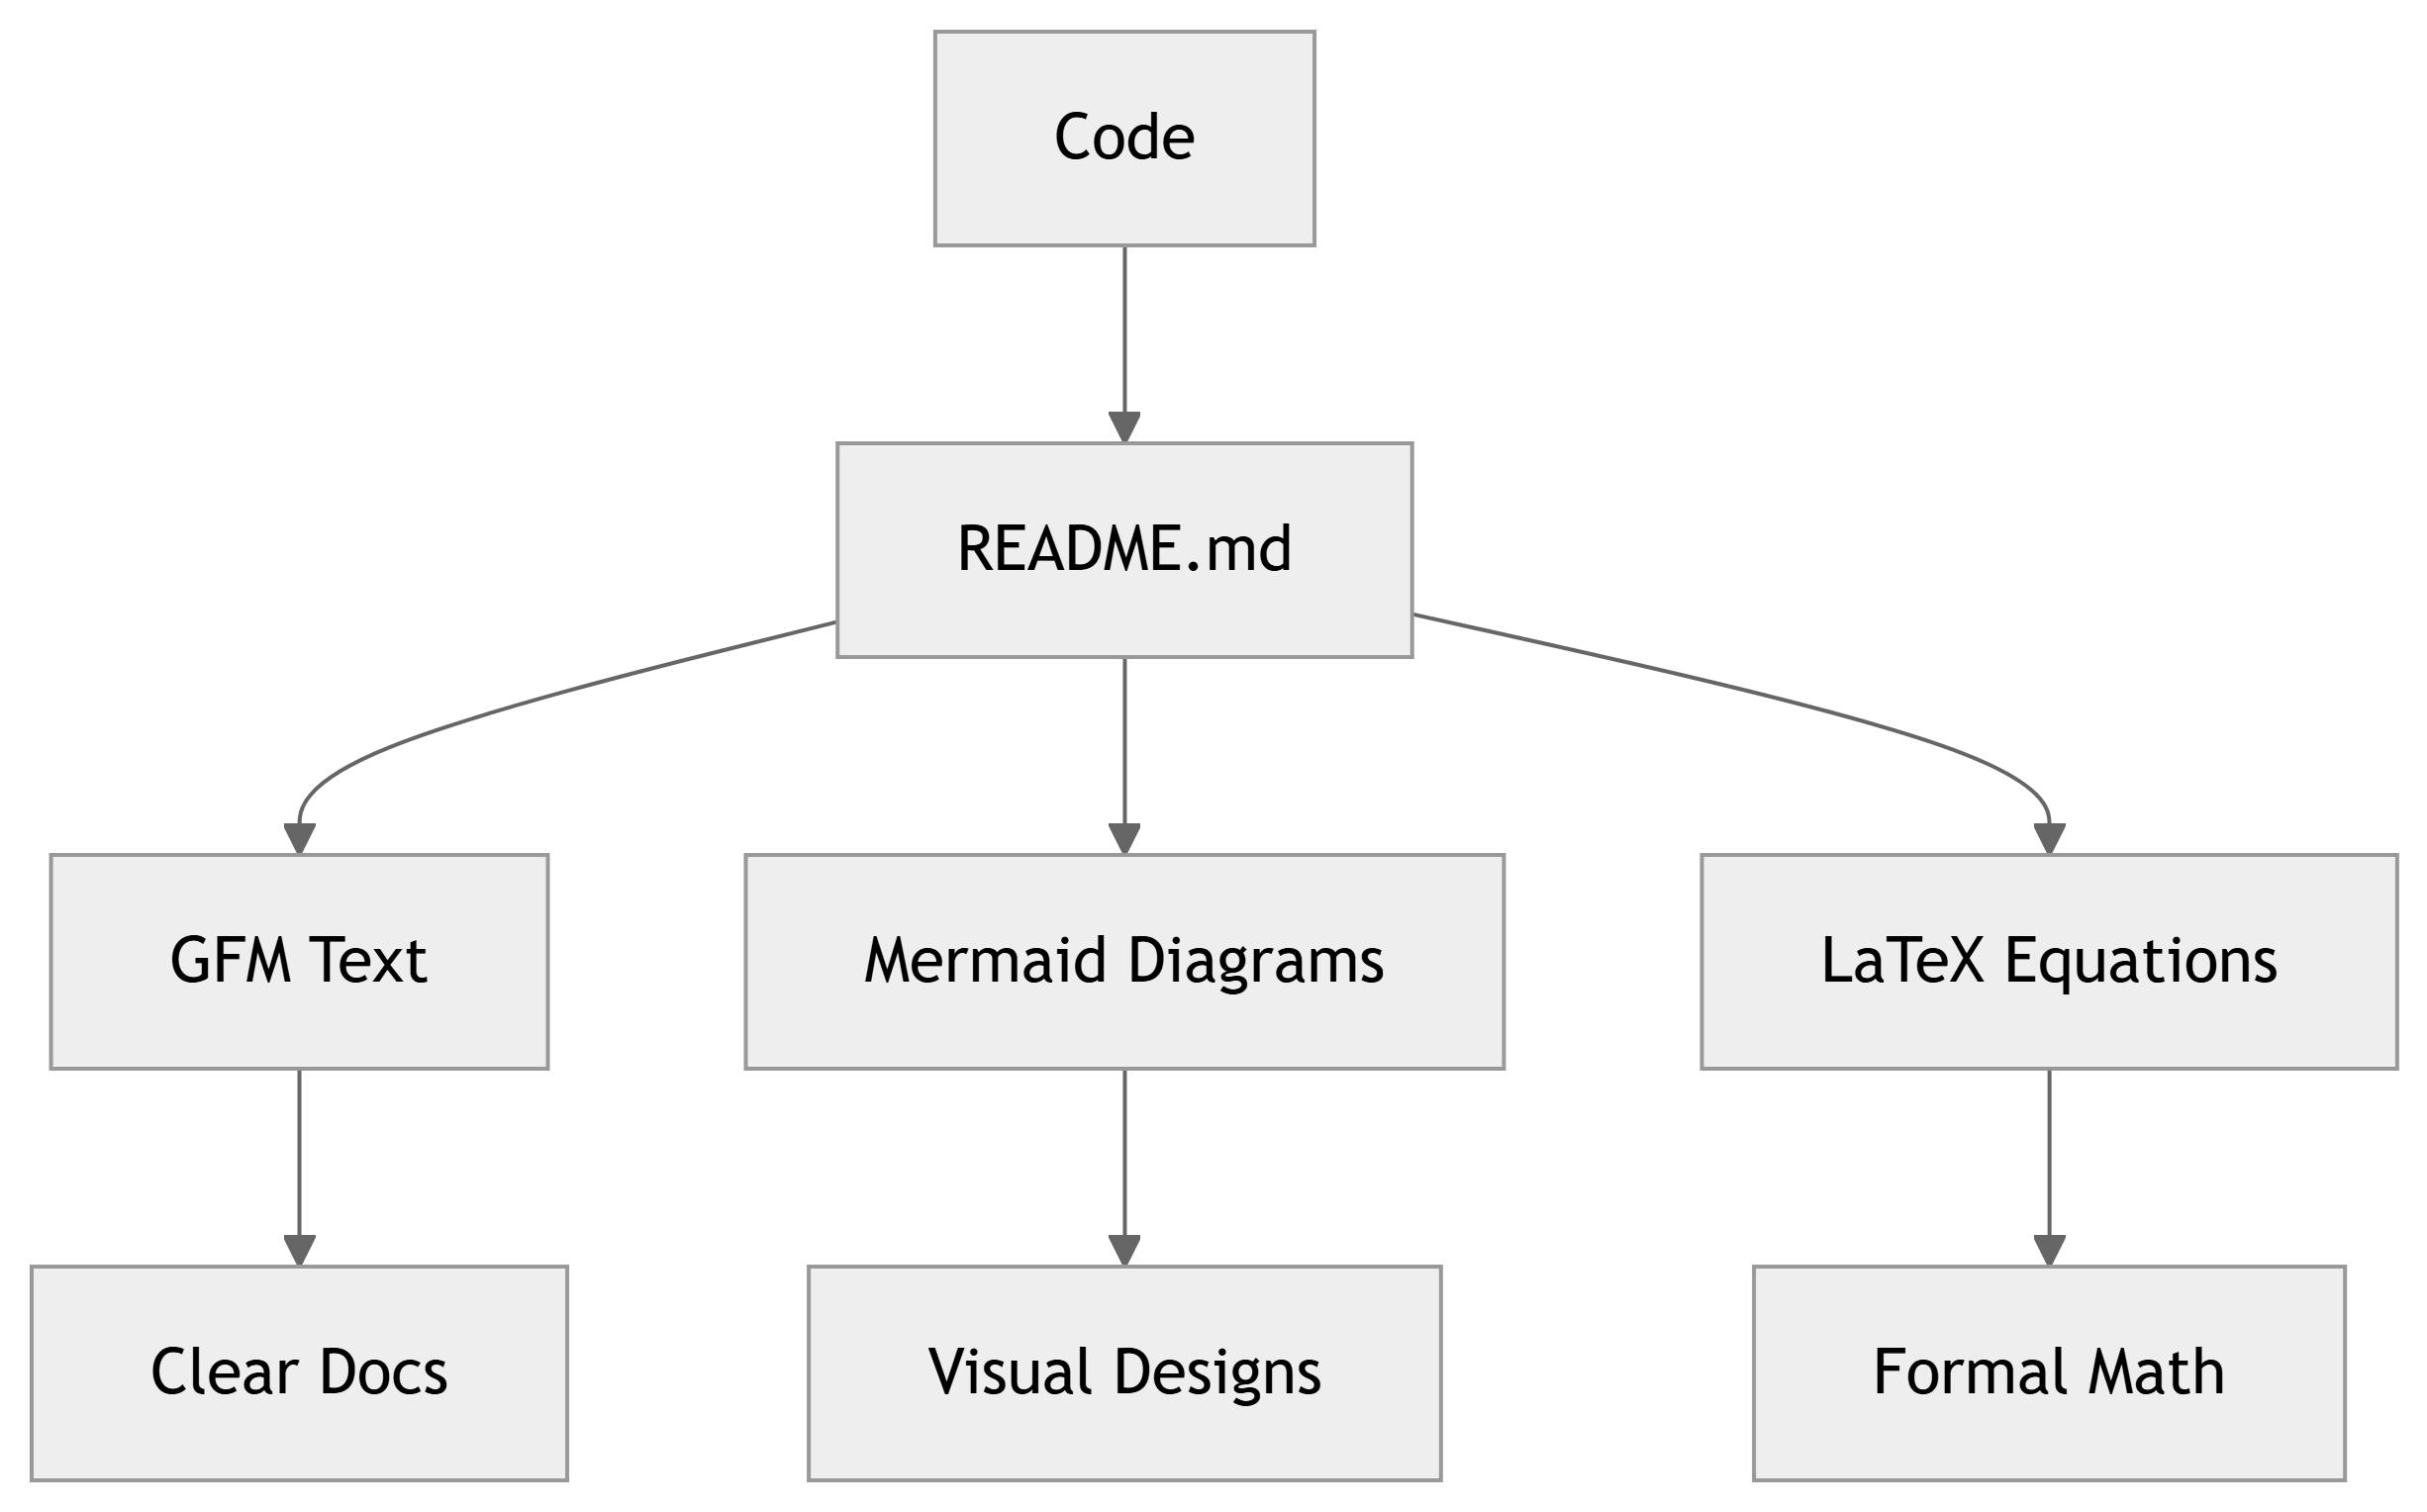
- GFM + Mermaid + LaTeX let you:
- Explain algorithms and protocols.
- Show system architectures.
- Derive and present equations.
- All using plain text files in your repo.
Part 1: GitHub Flavored Markdown (GFM) – Overview
GitHub Flavored Markdown extends basic Markdown with extra features:
- Headings, lists, emphasis, code blocks.
- Tables, task lists, and fenced code blocks with syntax highlighting.
- Inline HTML (in some cases).
You can use GFM in:
README.md,CONTRIBUTING.md,LABx.md.- Issues and PR descriptions.
- Wiki pages.
Note
Markdown is plain text → easy to diff, review, and version using Git.
GFM Basics: Headings and Paragraphs
Use # for headings:
Rendered result:
Section Heading
Subsection Heading
Paragraphs:
- Separate paragraphs with a blank line.
- No special marker needed.
GFM Basics: Emphasis and Line Breaks
Use * or _ for emphasis:
Rendered:
This word is italic. This is bold. You can combine bold and italic.
Line breaks:
- One line in Markdown usually wraps automatically.
- To force a line break without a new paragraph, end the line with two spaces.
GFM Lists: Bulleted and Numbered
Rendered:
- First item
- Second item
  - Nested item
- Third item
GFM Code: Inline and Blocks
Use backticks for inline code:
Use triple backticks for code blocks (optionally with language):
Rendered:
Tip
Always specify the language (e.g., c, python, verilog) for syntax highlighting.
GFM Tables
Tables in GFM are ASCII-based:
Rendered:
| Signal | Type | Description |
|---|---|---|
| VIN | Analog | Input voltage (0–3.3 V) |
| VOUT | Analog | Filtered output |
| CLK | Digital | System clock input |
You can align columns using colons:
GFM Task Lists and Links
Task lists (often used in issues and PRs):
Rendered as checkboxes on GitHub.
Links:
Rendered:
Note
Task lists are great for TODOs in issues or project boards.
GFM Image Embeds
You can embed images directly:
Rendered:
![]()
(Your actual image would appear here.)
Tips:
- Keep images in a folder like
images/ordocs/img/. - Use meaningful alt text: describes the image content.
GFM Example: Mini README
# FFT-Based Spectrum Analyzer

This project implements a real-time spectrum analyzer on an embedded board.

## Features

- 12-bit ADC sampling at 20 kHz
- 1024-point FFT using CMSIS-DSP
- UART output for spectrum data

## Usage

1. Flash the firmware to the board.
2. Open a serial terminal at `115200` baud.
3. Observe frequency peaks as you vary the input signal.

## TODO

- [ ] Add windowing options
- [x] Implement basic FFT
- [ ] Document serial protocolPart 2: Mermaid Diagrams – Overview
Mermaid lets you describe diagrams as text blocks in Markdown.
GitHub supports Mermaid in:
- Markdown files (
.md). - GitHub Wiki pages.
- Some other contexts.
Common diagram types:
- Flowcharts.
- Sequence diagrams.
- Class / entity-relationship diagrams.
- State diagrams, Gantt charts, etc.
Important
Mermaid diagrams live in your repo as code, so they can be versioned, reviewed, and edited like any other file.
Mermaid Basics: Flowchart Syntax
Basic pattern in GitHub Markdown:
Rendered (conceptually):
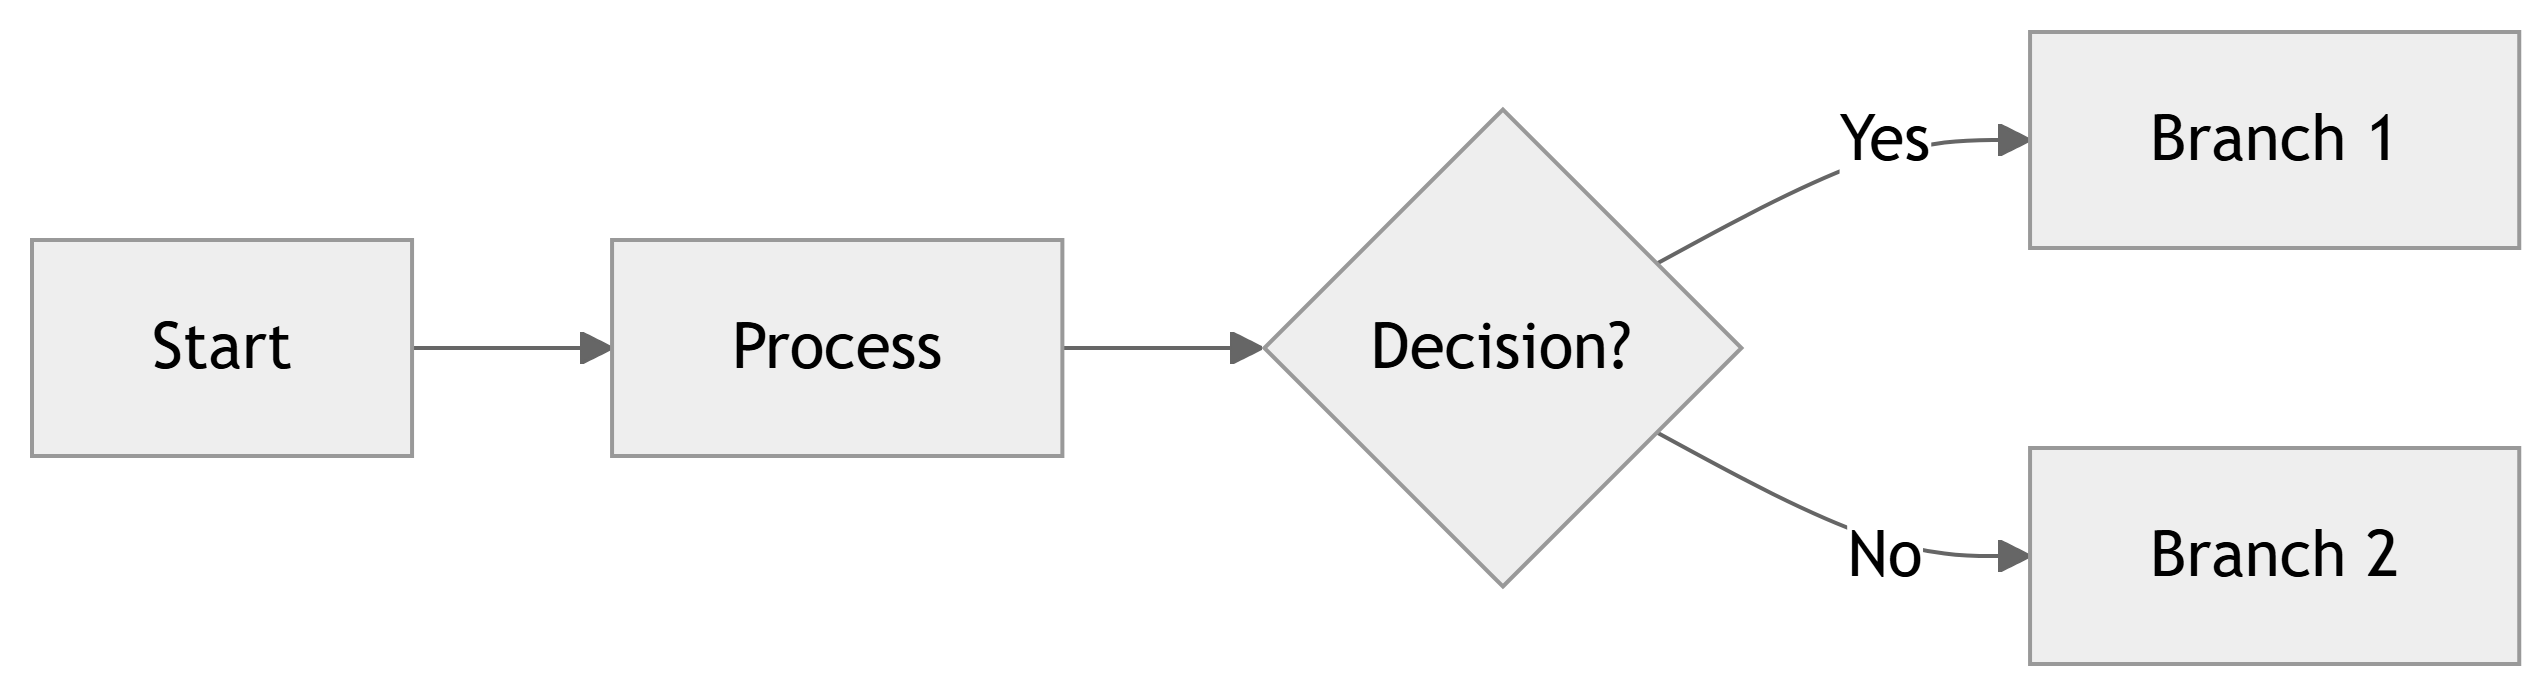
Key elements:
flowchart LR→ left-to-right flowchart.- Nodes:
A[...],B(...),C{...}etc. - Edges:
A --> B, optionally with labels:C -->|Yes| D.
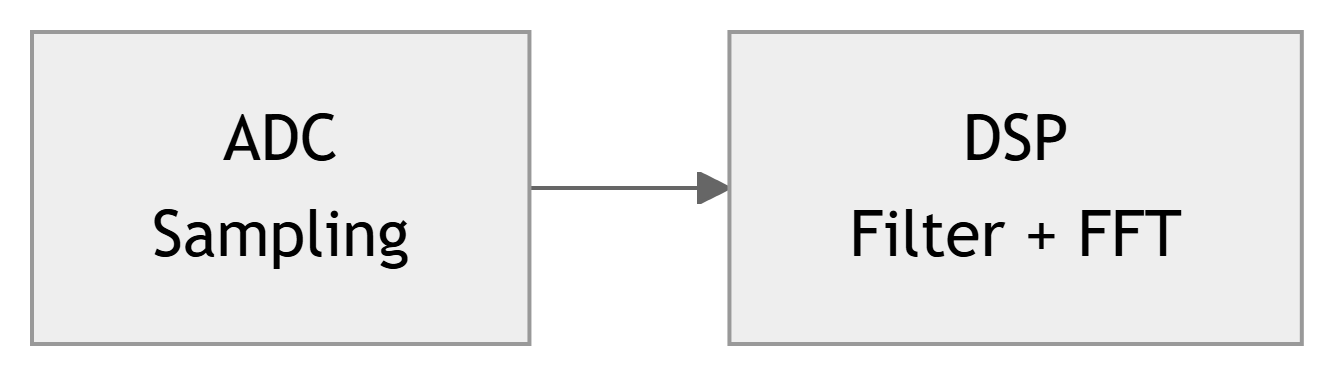
Mermaid Flowchart: ECE Example
ADC sampling + DSP + UART pipeline:
Rendered:

Use this in:
- README to show system overview.
- Design document to explain data flow.
Part 3: LaTeX Equations in Markdown – Overview
For math, many Markdown renderers (including Quarto and some GitHub contexts) support LaTeX syntax:
- Inline math:
$ ... $ - Display (block) math:
$$ ... $$
Examples work in:
- Quarto documents and slides.
- Many static site generators.
- Some GitHub tools (GitHub itself has limited direct LaTeX support, but GitHub Pages with MathJax, Quarto, etc., can render it).
Warning
GitHub’s native Markdown does not render LaTeX as math in all views by default. However, Quarto, Jupyter, and many documentation setups built on GitHub do.
Inline vs Display Math
Inline math:
Rendered:
The sampling frequency is \(f_s = 20\,\text{kHz}\) in this design.
Display math:
Rendered:
The discrete-time Fourier transform (DTFT) is given by
\[ X(e^{j\omega}) = \sum_{n=-\infty}^{\infty} x[n] e^{-j \omega n} \]
Common LaTeX Symbols and Expressions
Some useful patterns:
- Greek letters: $\alpha$, $\beta$, $\omega$, $\Omega$, $\phi$
- Subscripts: $x[n]$, $y_k$, $V_{\text{in}}$
- Superscripts: $e^{j\omega}$, $x^2$
- Fractions: $\frac{1}{2}$, $\frac{V_{\text{out}}}{V_{\text{in}}}$
- Square roots: $\sqrt{2}$, $\sqrt{1 - \alpha^2}$
- Sums and integrals: $\sum_{n=0}^{N-1} x[n]$, $\int_0^T v(t)\,dt$
Rendered examples:
- Greek letters: \(\alpha\), \(\beta\), \(\omega\), \(\Omega\), \(\phi\)
- Subscripts: \(x[n]\), \(y_k\), \(V_{\text{in}}\)
- Superscripts: \(e^{j\omega}\), \(x^2\)
- Fractions: \(\frac{1}{2}\), \(\frac{V_{\text{out}}}{V_{\text{in}}}\)
- Square roots: \(\sqrt{2}\), \(\sqrt{1 - \alpha^2}\)
- Sums and integrals: \(\sum_{n=0}^{N-1} x[n]\), \(\int_0^T v(t)\,dt\)
ECE Example: Discrete-Time Filter
Rendered:
A first-order IIR low-pass filter can be written as
\[ y[n] = (1 - \alpha)\,x[n] + \alpha\,y[n-1], \]
where \(\alpha \in [0,1]\) controls the smoothing.
Systems Example: Transfer Function
Rendered:
The transfer function of a simple RC low-pass filter is
\[ H(j\omega) = \frac{1}{1 + j \omega R C}. \]
The magnitude response is
\[ |H(j\omega)| = \frac{1}{\sqrt{1 + (\omega R C)^2}}. \]
Matrices and Vectors
Rendered:
The state vector is
\[ \mathbf{x} = \begin{bmatrix} x_1 \\ x_2 \\ x_3 \end{bmatrix}. \]
The state-space model is
\[ \dot{\mathbf{x}} = A \mathbf{x} + B \mathbf{u}, \quad \mathbf{y} = C \mathbf{x} + D \mathbf{u}. \]
Combining GFM, Mermaid, and LaTeX
You can mix all three in one Markdown document or Quarto doc:
# Digital Filter Module

We implement a FIR filter with impulse response

$$
h[n] = \begin{cases}
\frac{1}{M}, & 0 \le n < M \\
0,           & \text{otherwise}
\end{cases}
$$

## Data Flow

```mermaid
flowchart LR
  X["Input x[n]"] --> FIR["FIR Filter h[n]"]
  FIR --> Y["Output y[n]"]
```

## Test Procedure

1. Generate a sine wave input using `test_signal.py`.
2. Capture output samples and compute the FFT.
3. Verify that the passband gain is approximately $1$ and stopband is low.Example: Embedded System Overview Document
# Temperature Monitoring System

## System Overview

```mermaid
flowchart LR
  Sensor[Temp Sensor] --> MCU[Microcontroller]
  MCU --> Display[7-Segment Display]
  MCU --> Logger[UART Logger]
```

## Sensor Model

The sensor output voltage is

$$
V_{\text{out}} = S \cdot T + V_{\text{offset}},
$$

where $S$ is sensitivity (V/°C), and $T$ is temperature in °C.

## TODO

- [ ] Calibrate sensor at 0°C and 100°C
- [ ] Implement UART logging protocol
- [x] Basic display driver- Uses GFM for structure, lists, and TODOs.
- Uses Mermaid for block diagram.
- Uses LaTeX for sensor equation.
- Entire doc lives in
docs/temperature-system.mdin the repo.
Practice Guide: What You Should Try Next
To solidify these skills, create a new Markdown file in a repo:
- GFM Practice
- Write a mini-README with headings, lists, code blocks, and a table.
- Mermaid Practice
- Add a flowchart of a system (e.g., sensor → MCU → actuator).
- Add a small sequence diagram for a communication protocol.
- LaTeX Practice
- Include at least two inline equations and two display equations.
- One should be an ECE-relevant formula (e.g., filter equation, Ohm’s law, transfer function).
Tip
Start small. You don’t need perfect diagrams or equations at first. Iterate as you would with code.
Summary / Key Points
- GitHub Flavored Markdown (GFM):
- Use headings, lists, code blocks, tables, task lists, links, and images.
- Ideal for READMEs, lab guides, and design docs.
- Mermaid Diagrams:
- Write diagrams as text (flowcharts, sequence diagrams, class diagrams).
- Perfect for showing data flow, protocols, and architecture.
- LaTeX in Markdown:
- Use
$...$for inline and$$...$$for display math. - Present equations, derivations, and models clearly.
- Use
- Combining all three gives you powerful, maintainable, version-controlled documentation for ECE projects.